Chapter 0
Statistics and Statistical Visual Representations
Project Directions and Rubric
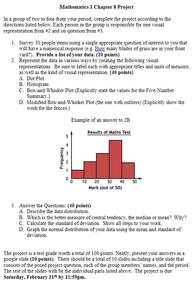
Click on image to see the Project Directions.
|
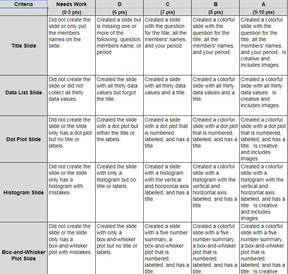
Click on image to see the Project Rubric.
|
Samples Project Material
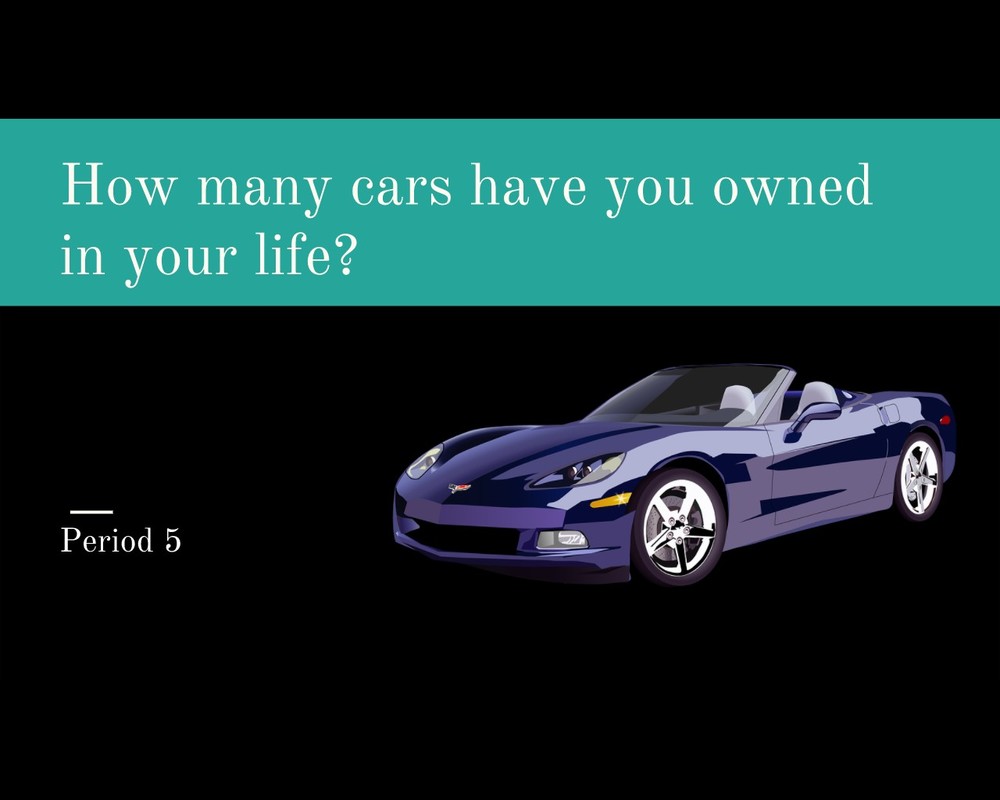
Click on image to See the Sample Project
|
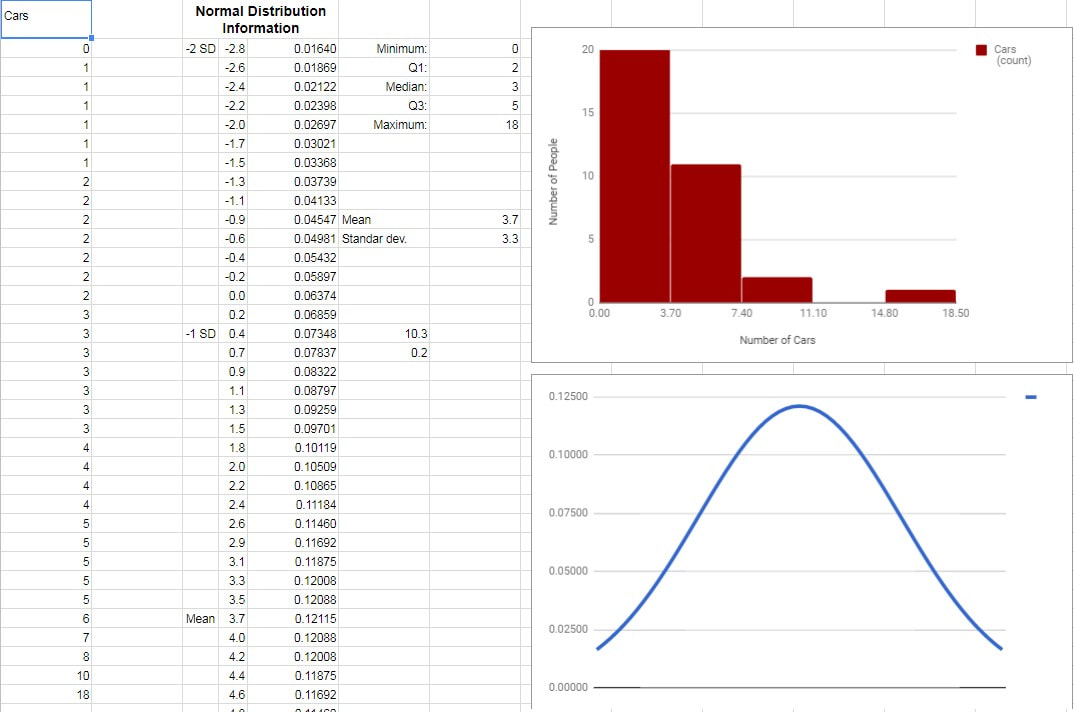
Click on image to See the Sample Sheet for the Project
|
Guide Videos for the Chapter 8 Project
|
Creating A Histogram using Google Sheets. Then Importing the Histogram into your Slides Presentation.
Creating datasheet and a Dot Plot using Sheets
|
Creating a 5 Number Summary using Google Sheets.
|
Finding your Interquartile Range (IQR), Fences, and Modified Box and Whisker Plot.
|
Finding the Mean and Standard Deviation using Sheets.
|
